Visualizing the Fictional Community
An important part of the Disaster Response narrative is visualizing the community as the disaster unfolds over it and as the players respond to the incidents (cases) that arise as a result of the flood. The simulation environment (game map) has undergone many iterations and refinements with an initial approach using unequal shaped squares relating to neighborhoods. In both the original and current conception of the game, the game map players would move around the map to identify cases and respond to them.

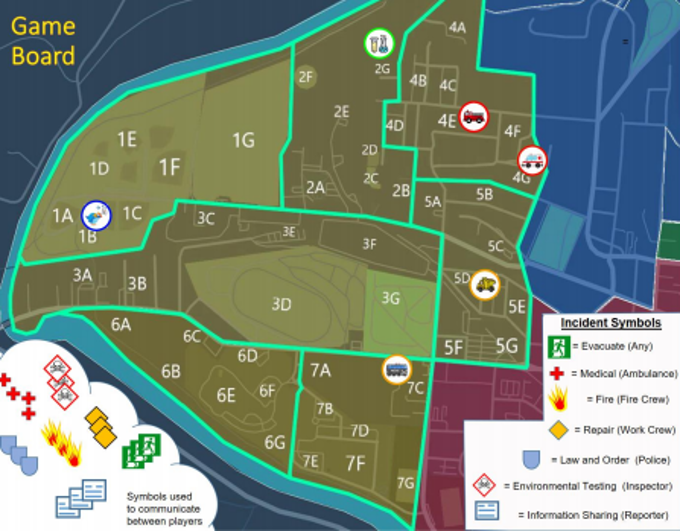
Figure 1 – Early simulation map design
Figure 1 shows this early prototype map with irregularly shaped neighborhoods that simulate the kinds of terrain differences that an irregular shape allows. Each asset (ex: residential setting or building) that a kind of incident could impact was marked with a neighborhood number (ex: 3) and an asset id (ex: A). In the original prototype, as a game piece moves into a neighborhood, they would get notified of cases that existed in that neighborhood.

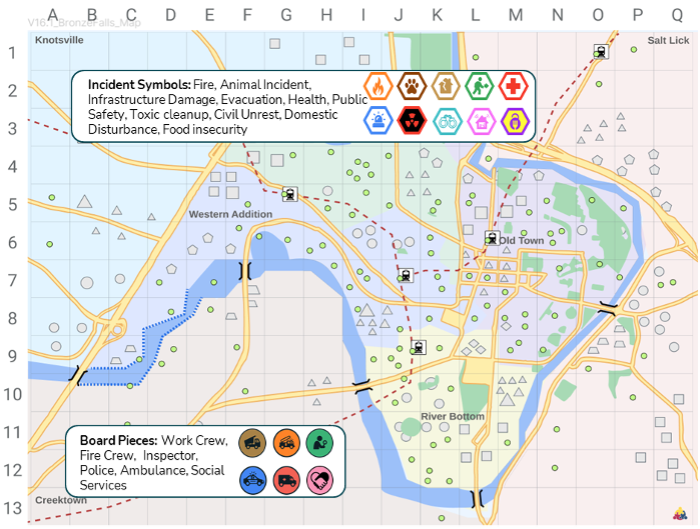
Figure 2 – Current prototype simulation map design
Figure 2 shows the current approach using regularly shaped squares that are each identified by a grid location. The logic in the new map approach is similar in that players still move tokens on the game map to discover and resolve cases. Movement in the new map occurs in three ways: on squares, on roads, and through the rail system. Each token has a pre-defined number of moves in each move sequence (described below). Those moves can be used to position the token or to resolve cases. Unused moves are carried forward into subsequent move cycles.
Move Cycles
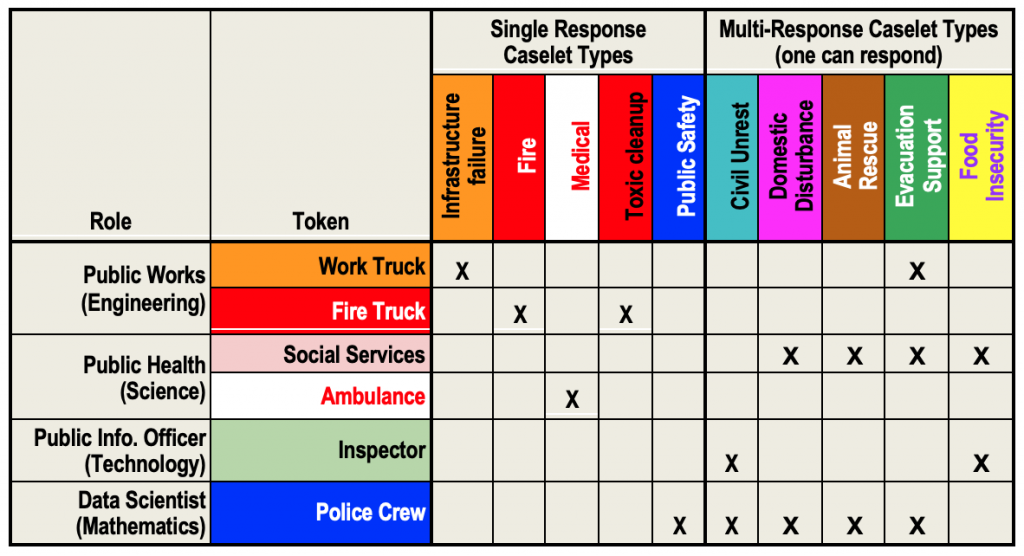
The objective of the game is to resolve as many cases as possible. Cases can be discovered by several methods. As players move their tokens into locations, they are alerted to the presence of cases in the nearby area. The cases they are notified about can be for them to resolve or for other players to resolve. Some cases can be resolved by only one kind of player token and some can be resolved by more than one. Determining who should respond to the various cases that are presented to a team is an opportunity for collaboration.
Resolving Cases and Scoring
One of the project’s design challenges is to simulate a simultaneous kind of event structure in a way that players can either play in a synchronous mode where all players move at the same time or an asynchronous mode when players can move at different times. While synchronous is preferred, students may have conflicts that arise from work or other school project teams, so it is possible for players to make their moves in advance. The approach chosen to support participation this way is to have moves made in move cycles where each team schedules their move cycle at a time that is convenient for their schedules. Each move cycle will support synchronous or in advance movement. There will be several move cycles that relate to a single action sub-phase. Current planning is for three sub-phases with three move-cycles for each sub-phase, giving a total of nine move cycles for each player. Playtesting will help determine the appropriate number of moves as well as move cycles.

Table 1 – Token to cases resolution match
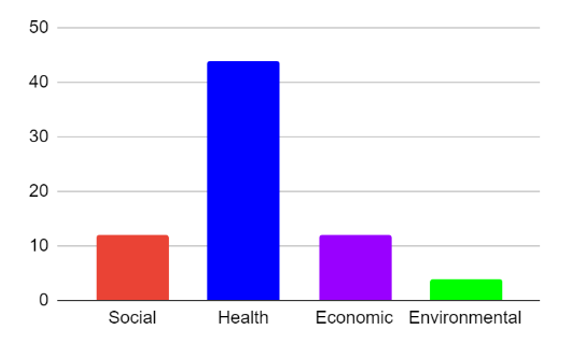
Each case that a player resolves in the game contributes to their team score that all players in a team share. There are four scoring categories that relate to resilience indicators used in professional settings: environmental, economic, social, and health and safety. The players see a common scoreboard that updates with each resolved case.
After the simulation has ended the team will be presented with another score having to do with the cases the players were unaware of.

Figure 3 – Sample team scoreboard
Public Information Officer (PIO) Information Feed
The public information officer (PIO) has only one token on the board. However, s/he also has a special information feed that will provide information on a selected subset of cases throughout the community. This report combined with the Inspector token that can easily see cases will make the PIO a source of information about active cases.
Data Science Reports
The cases in the game are not static. Each move cycle will have several new cases that will be created based upon the evolving narrative and what cases have been resolved. For example, if there is a fire and it is not resolved (put out) then it could spawn another fire the next move cycle. Also, as the flood progresses, and the water level rises there will be other cases that will emerge. In addition, there may be food insecurity issues and public disturbance coming in a later move. What this means is that there will be cases that are coming in most move cycles. The Data Scientist will have a report that will show probabilities of cases coming in the following move cycles so that the players can choose to investigate the future as they plan subsequent moves.
Team Member Spotlight: Fikir Derese
Fikir is majoring in Information Science at the University of Maryland. She is actively involved in designing the Disaster Response PCS. Fikir is working on mapping Bronze Fall, developing caselets, the game technology, and creating resident files. Fikir is an artist who excels at digital painting.
She is a cinephile so if you need a film recommendation send her a message. In her free time, Fikir loves to read, discuss philosophical topics with her friends, and playing with her 5-year-old nephew.

Figure 4 – Fikir Derese
Careers In Play Leadership Team
Phil Piety, PhD. University of Maryland iSchool (PI and Learning Analytics). ppiety@umd.edu
Beth Bonsignore PhD. University of Maryland iSchool (Co-PI and Design-based Research), ebonsign@umd.edu
Derek Hansen, PhD.Brigham Young University (Co-PI and Game Technology). dlhansen@byu.edu
Dan Hickey, PhD. Indiana University School of Education (Co-PI, Learning Theory and Assessments). dthickey@umd.edu
