Learning Analytics
April saw progress with the learning analytics component of the project. Learning analytics is a broad term that can mean different things to different discourse communities. For this project, it is a system that will collect information from the playable case study (PCS) technology as players work through the narratives. The learning analytics technology is also being developed to be reusable. From the beginning this part of the project is being designed as a general purpose technology that other researchers could use and adapt.
Release Program
The learning analytics programs are being developed in an iterative manner with areas of the database designed and built with then that area being tested with various data load programs to ensure the database design meets the needs of the project. After this is done successfully then the program code that will be used to send information securely into the database is developed. This is the Representational State Transfer (REST) Application Programming Interface (API) code and that is developed and tested. The tests utilize a Jupyter Notebook approach so that all successful and unsuccessful data conditions can be tested and documented.
Similar to the way that the Android operating system until recently named each release based off of a kind of sweet or confection, each one of this project’s learning analytics versions were named after a kind of game as table 1 shows.

Table 1- Learning Analytics release list
Open Source Technology
While this project does not support community building related to the open source platform for learning analytics, the project is using the technologies and approaches of an open source program including the GitHub code repository and a website (learnproject.umd.edu) that can be used to share more information about the project when it is further along. The LEARN project stands for Learning Environment Analytics Research Network. The idea behind this name is that as the technology becomes more mature it can be used by other researchers and those researchers can contribute to its capabilities and in the process there is the potential with this technology to become a boundary object for a community of like-minded researchers.
Mocking up Displays (dashboards)
During April a number of initial designs to highlight the information about student messaging that can be stored in the database were developed. These displays, also known as dashboards, are initial designs that show some of what is possible with this analytics system.

Figure 1 – Comparisons of message quantity by different players over time.
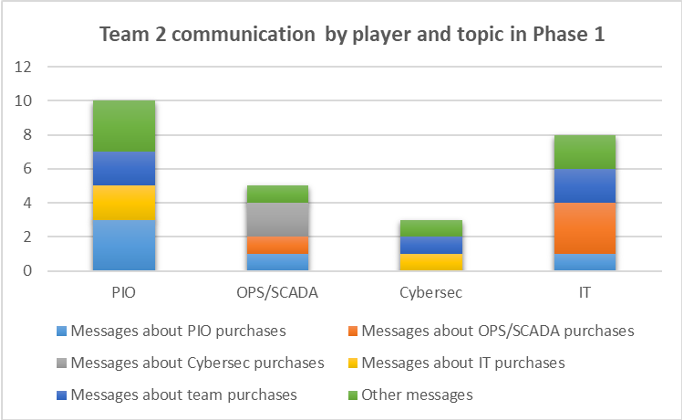
This kind of a longitudinal view can show how teams engage or not over the course of the virtual days in the game. It may also be possible with some basic natural language processing tools to infer what the messages students are sending each other are about. In Phase 1, the choices students have for how they spend their virtual money have names specific to each role. The messages can be analyzed for the presence of these topic names to produce information like that shown in Figure 2.

Figure 2 – Example of player communication patterns
Technology Behind the Scenes
Learning analytics systems create an informational lens onto practice. The view the learning analytics information system provides is not the only one available to teachers and students. Figure 3 shows the kinds of information contained in this system while Figure 4 illustrates the technical architecture.

Figure 3 – Conceptual information architecture of the learning analytics engine.

Figure 4 – High-level conceptual schematic of the technical architecture
Since the PCS technology was to be separate from the secure analytics environment two cloud environments were developed: a semi-proprietary for the PCS support that used a model that allowed multiple kinds of concurrent uses (multi-tenant) and an open source code running in a secure cloud environment running on Amazon Web Services (AWS). Additionally, the structure allows for different host institutions that might extend beyond the initial grant collaborators to participate using their own learning management systems. The design needed to account for both secure management of student data that could be collected from multiple locations/institutions as well as only allowing research to be conducted on data collected from students who had given permission.
Team Member Spotlight: Revati Naik
Our team is fortunate to have a number of talented students working on it. One of the most important members of our team is Revati Naik. Revati is a masters student in the robotics program at the Clark School of Engineering. Revati is interested in robotics for education. Revati has been involved with a number of education projects and is currently exploring the development of a robotics education program.
For Careers in Play, Revati is a Software Engineer responsible for the REST API development. Once the database is designed then Revati will manage the development of the software that will be used to update and access the database.

Figure 5 – Revati Naik, Software Engineer
Careers In Play Leadership Team
Phil Piety, PhD. University of Maryland iSchool (PI and Learning Analytics). ppiety@umd.edu
Beth Bonsignore PhD. University of Maryland iSchool (Co-PI and Design-based Research), ebonsign@umd.edu
Derek Hansen, PhD.Brigham Young University (Co-PI and Game Technology). dlhansen@byu.edu
Dan Hickey, PhD. Indiana University School of Education (Co-PI, Learning Theory and Assessments). dthickey@umd.edu
